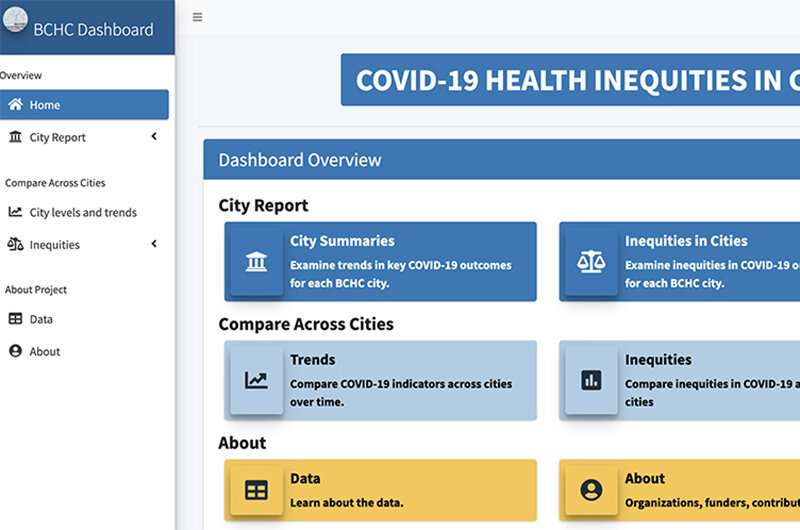
The Urban Health Collaborative, housed in Drexel University’s Dornsife School of Public Health, recently published its “COVID-19 Health Inequities in Cities” dashboard—which exposes deeply entrenched inequities in cities across the United States through the lens of comprehensive data on COVID-19 outcomes. Unlike other COVID-19 dashboards that look at data at broader scales, the Drexel website offers data on inequities at the individual (racial/ethnic disparities), neighborhood (using zip code and social vulnerability measures from the Centers for Disease Control and Prevention), and city (characteristics such as overcrowding, health infrastructure, etc.) levels on COVID-19 outcomes including vaccination rates.
The tool helps policy makers, public health officials, researchers, journalists, and others working in the fight against COVID-19, to instantly pull together charts and graphs using up-to-date data on various COVID-19 outcomes.
Available on the platform (using data updated daily, weekly or monthly):
- Disparities in vaccination rates across different racial/ethnic groups and neighborhoods
- City-wide reports on total tests, cases, hospitalizations and deaths, and trends on those metrics over time
- Inequities in COVID-19 outcomes by race/ethnicity across different cities
- Data on COVID-19 outcomes by neighborhoods within cities and how outcomes vary according to neighborhood characteristics such as poverty levels, housing and types of jobs.
“Reaching all communities is the only way to get this pandemic under control,” said co-Principal Investigator Usama Bilal, MD, Ph.D., an assistant professor in Drexel’s Dornsife School of Public Health. “As shown by this tool, much work remains across the United States to ensure marginalized communities have the resources to combat the spread of COVID-19.”
The platform’s data demonstrates that in nearly every U.S. city, neighborhoods with lower scores on the CDC’s Social Vulnerability Index—which looks at socioeconomic status, household data, minority status, language spoken and housing type and transportation—have lower rates of vaccination than neighborhoods that are more affluent.
Racial inequities are consistent across cities as well. Among all 15 cities with data available for vaccination, non-Hispanic Black residents had lower rates of vaccination than white residents. The same can be said for vaccination among Hispanics—except for San Francisco, in which Hispanics and white residents were fully vaccinated at similar rates.
“We hope that the information on inequities within and across cities in this dashboard can be of use not only to scientists and practitioners, but also to the public in understanding the underlying causes of health disparities and what we as a society should be doing about them,” said Principal Investigator Ana V. Diez Roux, MD, Ph.D., dean of the Dornsife School of Public Health.
The Drexel platform also shows the percentage of missing data for each city—a key gap that must be closed to eliminate racial disparities in testing, vaccination and COVID-19 health outcomes. For example, race and ethnicity data was missing for nearly half of vaccinations in the first month of vaccine rollout (Dec. 14, 2020 to Jan. 14, 2021). That number has since improved slightly, but racial data is still unavailable for roughly 43% of those vaccinated this far.
Data in this accessible tool is provided in part by local health departments that are members of The Big Cities Health Coalition (BCHC). The BCHC is a forum for the leaders of America’s largest metropolitan health departments to develop strategies and collaborate to promote and protect the health and safety of the roughly 62 million people they serve. The COVID-19 Health Inequities in Cities Project is supported by the Robert Wood Johnson Foundation and the de Beaumont Foundation.
Source: Read Full Article
