Sandra Rosenthal, Jack and Pamela Egan Professor of Chemistry and professor of pharmacology and chemical and biomolecular engineering, and collaborators have proposed that the seasonal rate of change in daylight has the greatest effect on illnesses with seasonal patterns, including bipolar disorder and major depressive disorder with a seasonal pattern, more commonly known as seasonal affective disorder. This means that it is the change in the amount of sunlight from the day before, not the amount of sunlight itself, that affects how a person with such an illness feels and experiences the world.
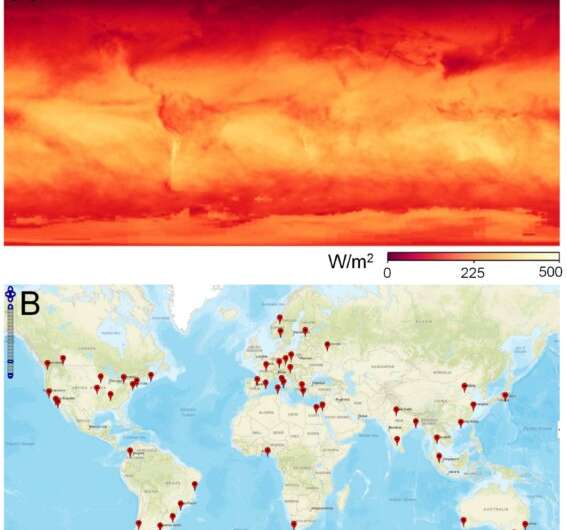
The team used NASA’s solar insolation data—the amount of solar radiation that hits the ground—to calculate the rate of change at 51 sites around the world. Travis Josephs, an undergraduate in neuroscience conducting this work as his Immersion Vanderbilt project, extracted NASA’s data. Localized to 11 square miles (roughly three-tenths the size of Walt Disney World), the data gave the team a granular level of detail that can help people identify exactly how changes to sunlight impact what they’re experiencing anywhere in the world.
“We noticed that even at the same latitude the patterns of change in solar insolation vary dramatically due to climate,” Rosenthal said. For example, during October in Los Angeles the rate of change of solar insolation ticks up because the Santa Ana winds push the marine layer out to sea. NASA data picked all of this up, including weather extremes like volcanic eruptions or smoke from wildfires.
Rosenthal has been living with bipolar disorder for 28 years and after the first seven years began to notice feeling better in spring and worse in fall. “In the third week of August I always went to the doctor because I always felt sick, like I had mono,” Rosenthal said. “Once I started paying attention to these precise dates, and after an enlightening conversation with bipolar disorder expert Kay Jamison, I realized just how common this seasonal pattern is.”
This research has the potential to give people with bipolar disorder and major depressive disorder with a seasonal pattern a tool to self-manage their illnesses. With data on the rate of change of solar insolation, people can make more informed adjustments to their compensation strategies, including working with their health care providers to adjust their medication and the timing of their light or dark therapy.
Clinicians aware of this research now have a momentous opportunity to help their patients identify patterns that affect their lives. “Little lightbulbs went off about patterns I experienced once I saw this data,” Rosenthal said. “This is no longer just a hunch. We now have the data to show that this pattern is real and true for people—not just myself. My hope is that this information resonates with others’ illnesses in a way that helps them.”
“Our collaboration began with a conversation about the photoperiod effects in an animal model of bipolar disorder, and we quickly realized that there was an interesting angle to pursue with respect to seasonal patterns in bipolar patients,” said Richard McCarty, a collaborator and professor of psychology. “Sandra’s personal experience with bipolar disorder was essential in moving these ideas forward and shaping the two publications.”
Rosenthal and her colleagues are engaging with esteemed academic researchers working on differences in sunlight and bipolar disorder who have taken their work to clinical settings. By sharing their data and the team’s calculations, Rosenthal anticipates further confirming their work.
Source: Read Full Article
